5 Data management and analysis
Data will be collected using an electronic data entry system based on the Open Data Kit (ODK) standard that runs on the Android® operating software (OS) platform for mobile devices. The study instrument (see Section 4) will be encoded into the electronic data entry system platform and will be served out of either a local computer server or a remote/cloud-based server4. Each study team will be provided with mobile devices running on Android® OS that have been configured with an application that will receive the electronic data form. All measurements and answers by respondents will then be recorded on the mobile devices and will then be transmitted to the local server or the remote server whenever there is a mobile phone and / or WiFi signal.
Appropriate data check mechanisms will be put in place using the data check systems available with the ODK system. Spot checks by study supervisor/s will be done in the field to ensure that enumerators are performing the measurements correctly, administering the study instrument correctly and entering all data accordingly. Further checks will be performed by the survey manager on the data as needed as they are received by the local server or remote server.
The digital data collection forms based on the Open Data Kit (ODK) standard using XLSform and XML is available at https://github.com/validmeasures/liberiaS3Mforms. The form faithfully replicates the paper-based forms described in Section 4. The form also faithfully replicates the sampling design described by the survey design such that proposed sampling interval within a primary sampling unit (PSU) is implemented as the survey team goes house-to-house finding SAM cases. The modules on IFA supplementation, IYCF counselling, vitamin A supplementation and MNP supplementation coverage appear appropriately on the digital forms when the correct household based on the sampling interval is being interviewed. The forms also appear appropriately based on eligibility of the child/mother as respnodents to the specific survey modules.
These forms can be viewed and tested using an Android-based mobile device. Instructions for usage can be found at https://github.com/validmeasures/liberiaS3Mforms.
Data analysis will be done using R language for statistical computing (R Core Team 2018) through bespoke analytic scripts put together into application-based workflow which can be used by non-R users. The application that will be created for this study will be designed such that an automatic reporting format is produced including maps, figures and tables of results.
5.1 Analytical approach for estimating coverage indicators
It is important to note that data analysis procedures need to account for the sample design. All major statistical analysis software can do this (details vary). There are two things to note:
- This survey is a two-stage sample. Subjects are sampled from a small number of primary sampling units (PSUs).
- This survey is not prior weighted. This means that per-PSU sampling weights will be needed. These are usually the populations of the PSU.
This sample design will need to be specified to your statistical analysis software. Failing this, the analysis may produce estimates that place undue weight to observations from smaller communities with confidence intervals with lower than nominal coverage (i.e. they will be too narrow).
For this survey, the blocked weighted bootstrap estimation approach will be used:
- Blocked : The block corresponds to the PSU or cluster.
- Weighted : The sampling procedure for this survey does not use population proportional sampling to weight the sample prior to data collection as is done with SMART type surveys. This means that a posterior weighting procedure is required. The “roulette wheel” algorithm to weight (i.e. by population) the selection probability of PSUs in bootstrap replicates will be utilised.
A total of m PSUs are sampled with-replacement from the survey dataset where m is the number of PSUs in the survey sample. Individual records within each PSU are then sampled with-replacement. A total of n’ records are sampled with-replacement from each of the selected PSUs where n is the number of individual records in a selected PSU. The resulting collection of records replicates the original survey in terms of both sample design and sample size. A large number of replicate surveys are taken (minimum of \(r = 399\) replicate surveys but this can be changed). The required statistic (e.g. the mean of an indicator value) is applied to each replicate survey. The reported estimate consists of the 50th (point estimate), 2.5th (lower 95% confidence limit), and the 97.5th (upper 95% confidence limit) percentiles of the distribution of the statistic observed across all replicate surveys. The blocked weighted bootstrap procedure is outlined in Figure 5.1.
The principal advantages of using a bootstrap estimator are:
Bootstrap estimators work well with small sample sizes.
The method is non-parametric and uses empirical rather than theoretical distributions. There are no assumptions of things like normality to worry about.
The method allows estimation of the sampling distribution of almost any statistic using only simple computational methods.
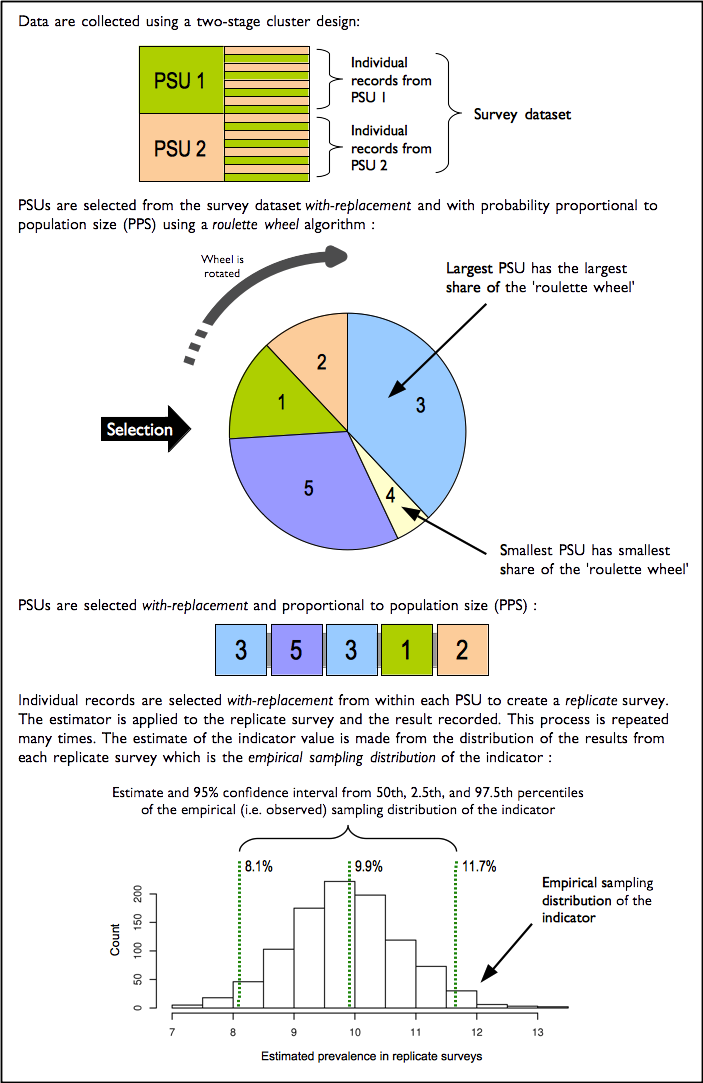
Figure 5.1: The blocked weighted bootstrap
5.2 Analytical approach for mapping coverage indicators
The indicator mapping will create a surface map of indicator values using spatial interpolation. There are various approaches and methods of spatial interpolation, the main differences are determined by the weights applied to the point dataset to estimate values at each of the unknown points of the surface map. For the Liberia coverage survey, spatial interpolation will be performed using the inverse distance weighting (IDW) method. As the name implies, the IDW method uses weights that are inversely proportional to the distance of a point being estimated from the sampling point locations (Isaaks and Srivastava 1989; Diggle and Ribeiro 2007; Diggle 2013). This can be mathematically demonstrated as follows:
\[\begin{aligned} \hat{v} & ~ = ~ \frac{\displaystyle \sum\limits_{i = 1}^{n} \frac{1}{d_{i}^{p}}v_{i}}{\displaystyle \sum\limits_{i = 1}^{n}\frac{1}{d_{i}^{p}}} \\ \\ where: & \\ \\ d_1 \ldots d_n & ~ = ~ \text{distances from each } n \text{ sampling points to estimation point} \\ p & ~ = ~ \text{power of the distance} \\ v_1 \ldots v_n & ~ = ~ \text{sample values} \end{aligned}\]
The power of the distance p is an important aspect of the IDW method for point estimation. The influence of p to the weights applied to the point estimation is such that as p approaches 0, the weights become more similar, thereby giving more weight to the nearest sample values. As p approaches \(\infty\), the weights become more different from each other, thereby giving more weight to the closest sample. The power of the distance p has been traditionally set at 2 for convenience and ease of calculations. In theory, given a set p, IDW calculations can be performed using manual calculations aided by a spreadsheet and / or a calculator as it requires fewer calculations. For the Liberia Coverage Survey, p will be initially set at 2 and then cross-validation (see below) will be applied to optimise p to a value that minimises the estimation errors at each of the sampling point locations.
Cross-validation is a technique applied to validate predictive models. It assesses how accurately the predictive model performs in practice. IDW is one of the simplest model-based interpolation methods available, but ideally would still require a form of cross-validation to determine the optimal value of the distance power p (described above).
A two-fold cross validation (Bivand, Pebesma, and Gómez-Rubio 2013) in which data points are randomly split into two sets of equal size, with one set assigned as the validation data for testing the model, and the other set as the training data. The validation data is then interpolated using the IDW method with an initial p of 2 and the resulting predictions were compared with the training data. Comparison is made using the sum of the squared residuals between the predicted values and the observed values to report errors. Optimisation is then performed by replicating the two-fold cross validation process 100 times using randomly generated values for p. Out of these replicates, the value of p that provided prediction results with the minimum errors is selected as the distance power for the eventual interpolation performed.
References
R Core Team. 2018. R: A Language and Environment for Statistical Computing. Vienna, Austria: R Foundation for Statistical Computing. https://www.R-project.org/.
Isaaks, E.H., and R.M. Srivastava. 1989. Applied Geostatistics. Oxford University Press. https://books.google.co.uk/books?id=vC2dcXFLI3YC.
Diggle, Peter J., and Paulo J. Ribeiro. 2007. Model-Based Geostatistics. Springer Series in Statistics. Springer.
Diggle, P.J. 2013. Statistical Analysis of Spatial and Spatio-Temporal Point Patterns, Third Edition. Chapman & Hall/Crc Monographs on Statistics & Applied Probability. Taylor & Francis. https://books.google.co.uk/books?id=XR8bAAAAQBAJ.
Bivand, R.S., E.J. Pebesma, and V. Gómez-Rubio. 2013. Applied Spatial Data Analysis with R. Use R! Springer New York. https://books.google.co.uk/books?id=4gg8yx\_lcj0C.
This will depend on what resources are available to the Liberia Institute of Statistics and Geo-Information Services. Valid International has resources to implement either a local server or a remote server solution.↩